Before importing access log data source
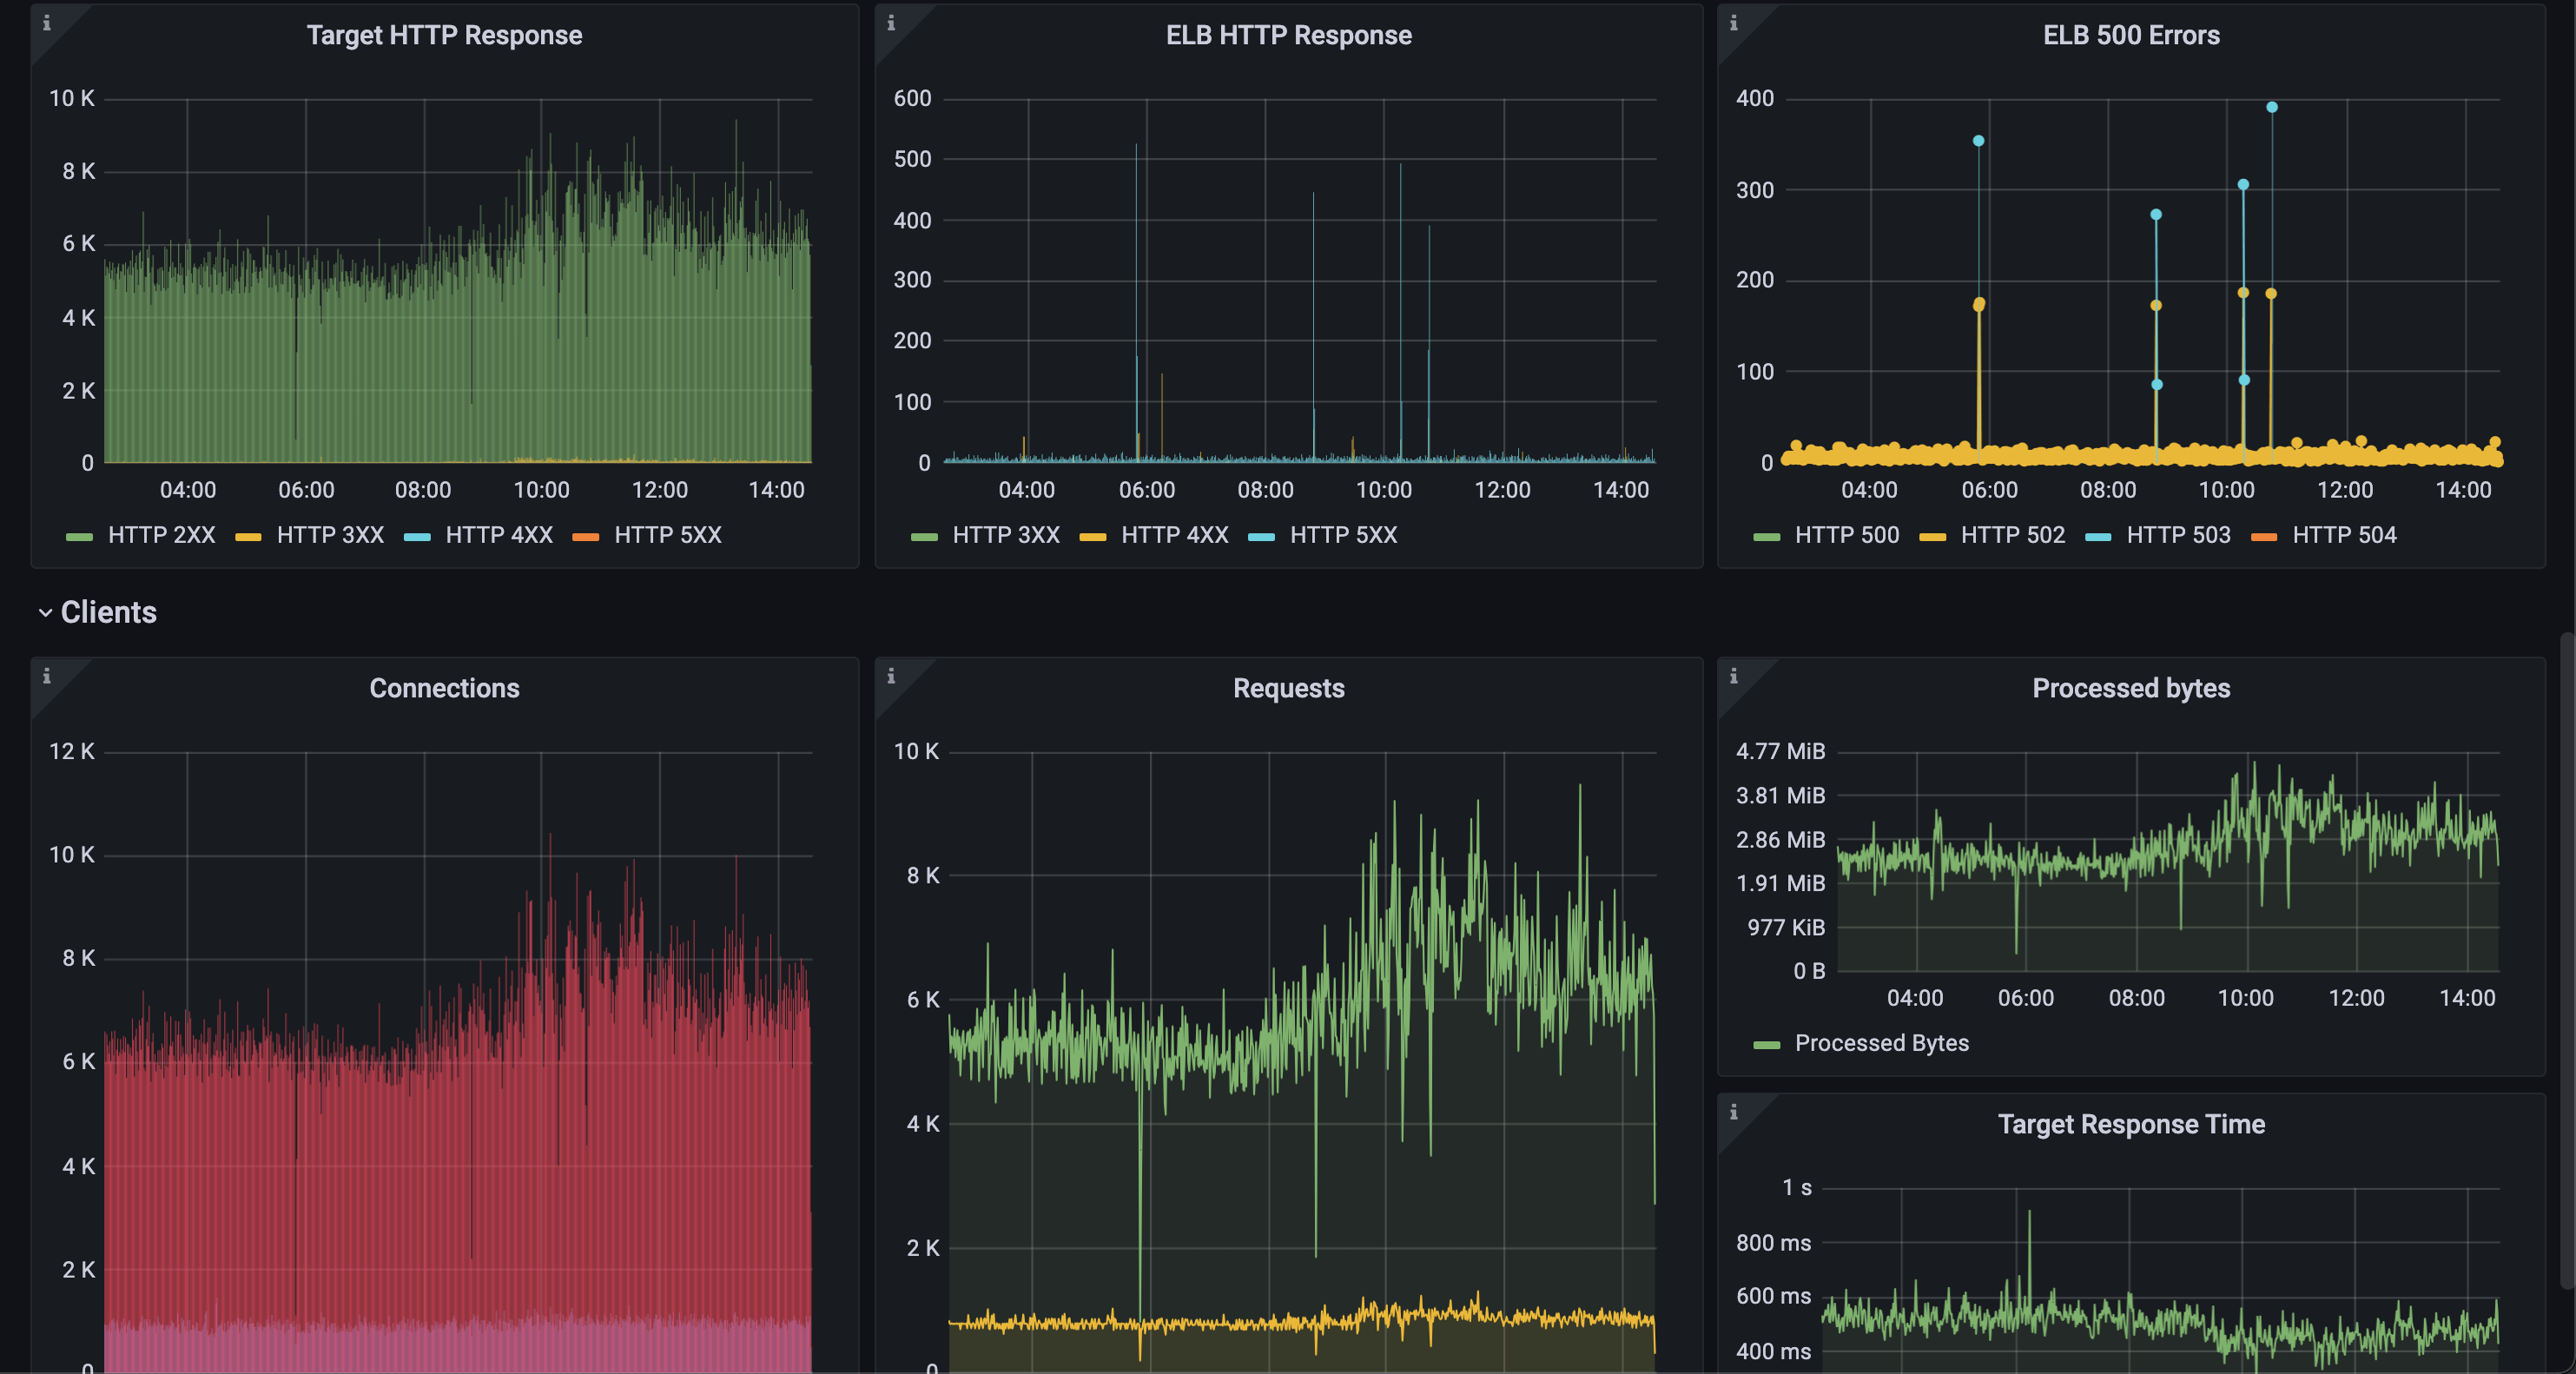
Monitoring Application Load Balancer(ALB) aggregated metrics in CloudWatch is easy, but if you want more insight from the access log, it is not enabled by default.
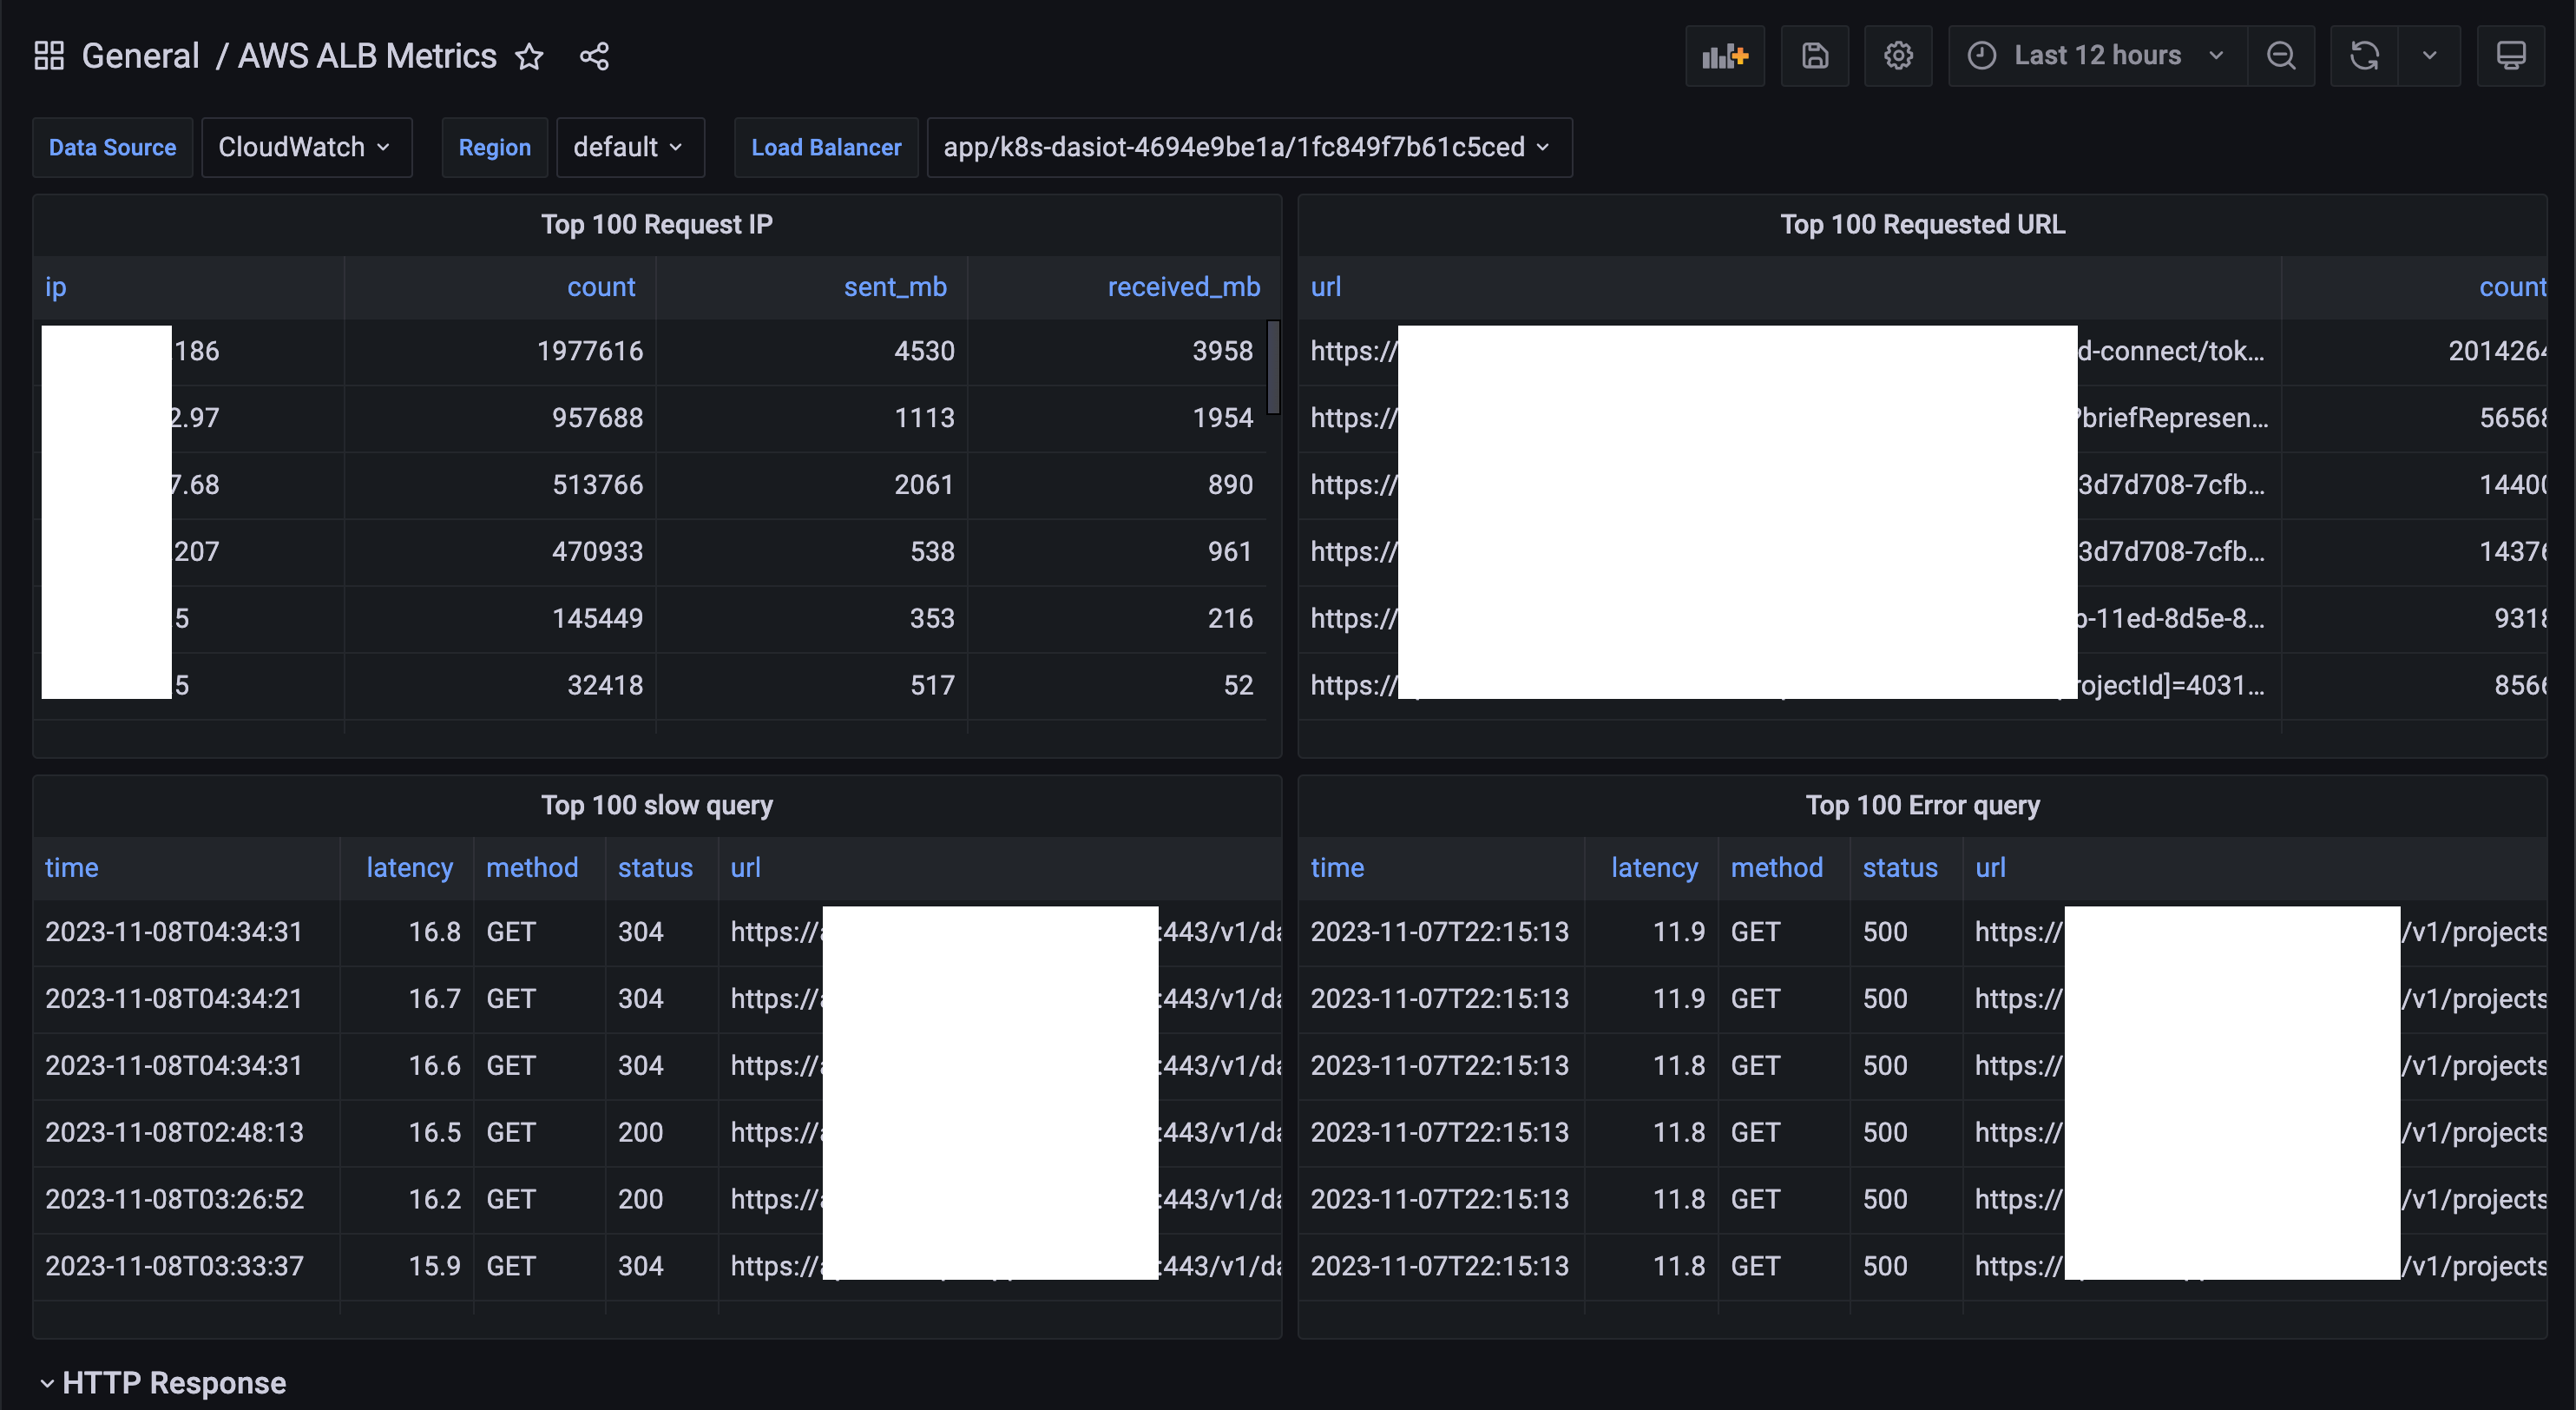
After import access log data source
I’ll set up an grafana dashboard with aws athena, alb, and s3 step by step.
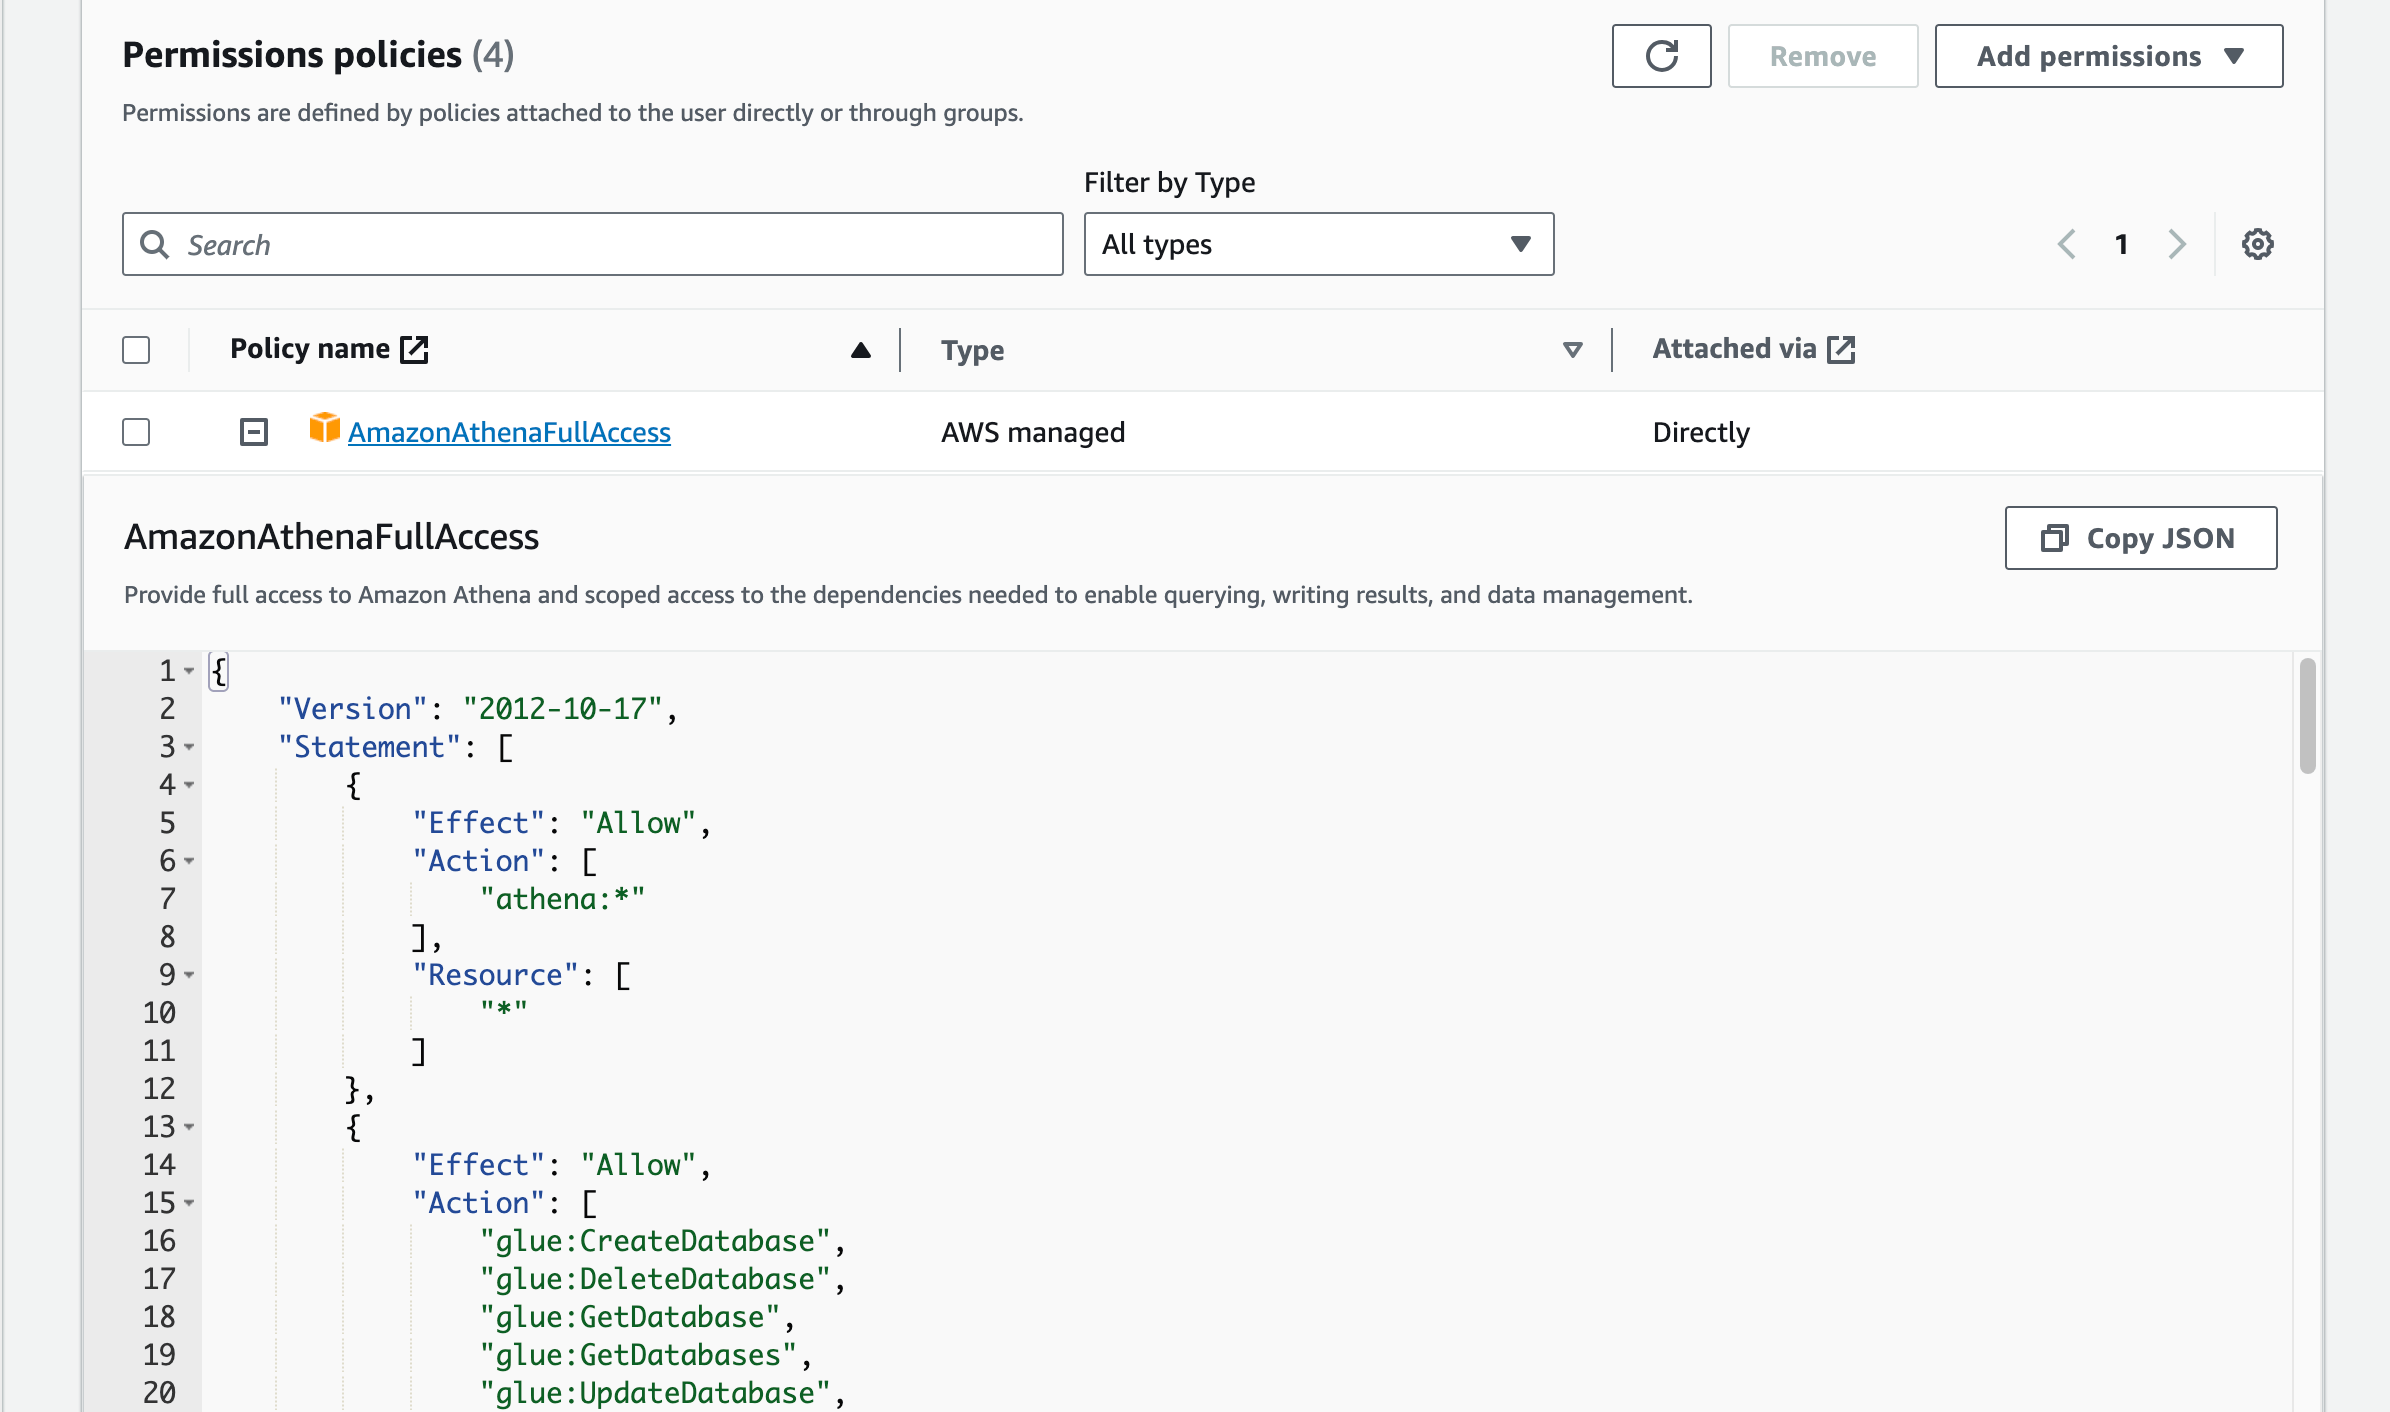
Create an IAM user for Grafana to access Athena
- Create an IAM user with the permission:
AmazonAthenaFullAccess - Create Access keys and keep the
Access Key IDandSecret Access Key - Copy the
arnfor the next step
Create a s3 log bucket for dumping alb access log
Create a s3 log bucket for dumping alb access log
Set up proper policy to be able to read, and write by your aws account (in aws console) or grafana
{
    "Version": "2012-10-17",
    "Statement": [
        {
            "Effect": "Allow",
            "Principal": {
                "AWS": [
                    "arn:aws:iam::11477413xxxx:root"
                ]
            },
            "Action": "s3:PutObject",
            "Resource": "arn:aws:s3:::xxxxxx-alb-access-log/alb/AWSLogs/35806030xxxx/*"
        },
        {
            "Effect": "Allow",
            "Principal": {
                "AWS": "arn:aws:iam::35806030xxxx:user/grafana-user"
            },
            "Action": "s3:GetObject",
            "Resource": "arn:aws:s3:::xxxxxx-alb-access-log/alb/AWSLogs/35806030xxxx/*"
        },
        {
            "Effect": "Allow",
            "Principal": {
                "AWS": "arn:aws:iam::35806030xxxx:user/grafana-user"
            },
            "Action": [
                "s3:GetObject",
                "s3:PutObject"
            ],
            "Resource": "arn:aws:s3:::xxxxxx-alb-access-log/athena/*"
        }
    ]
}
Enable ALB access log
Enable access log by Edit load balancer attributes

Set up Anthea
Create a workgroup and set the
Query result configuration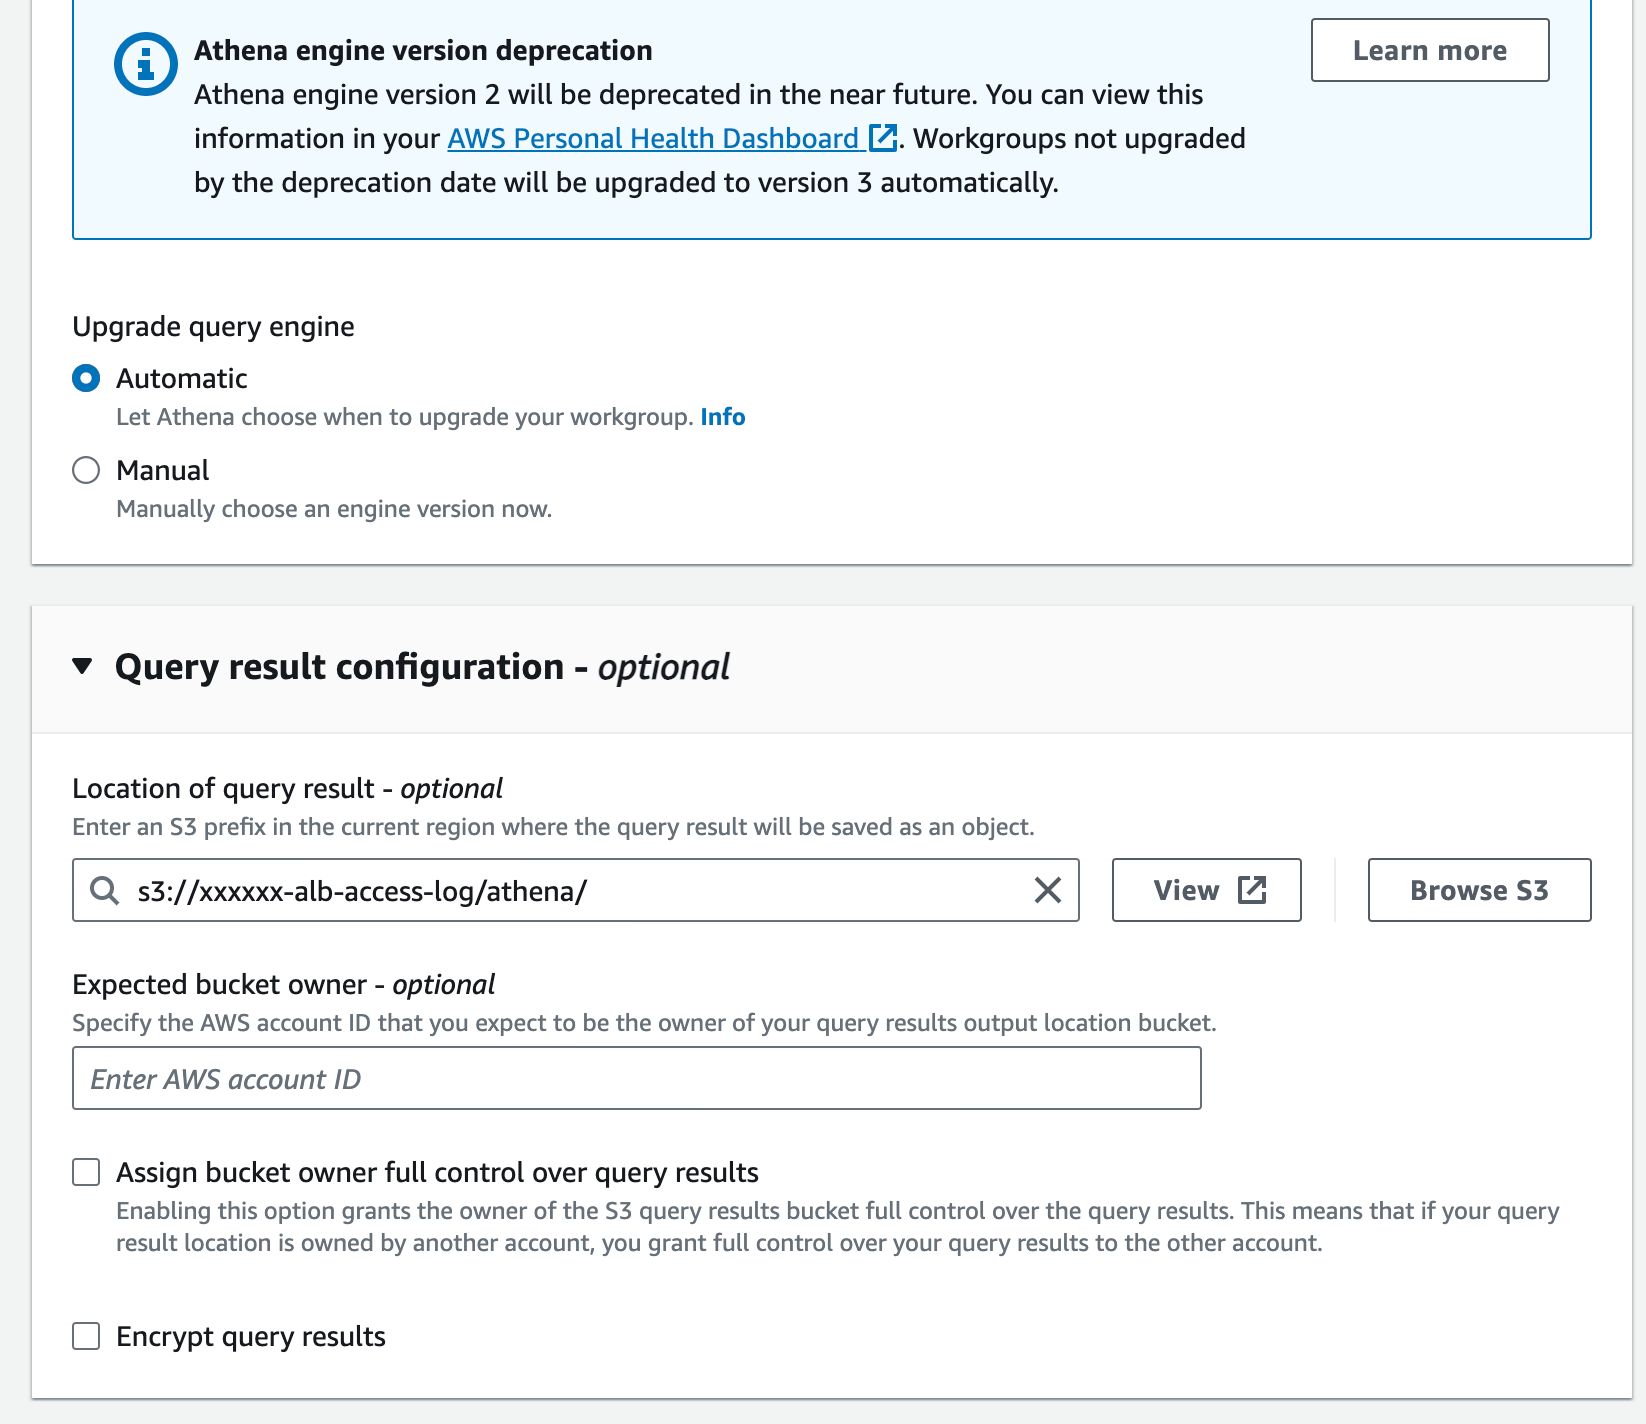
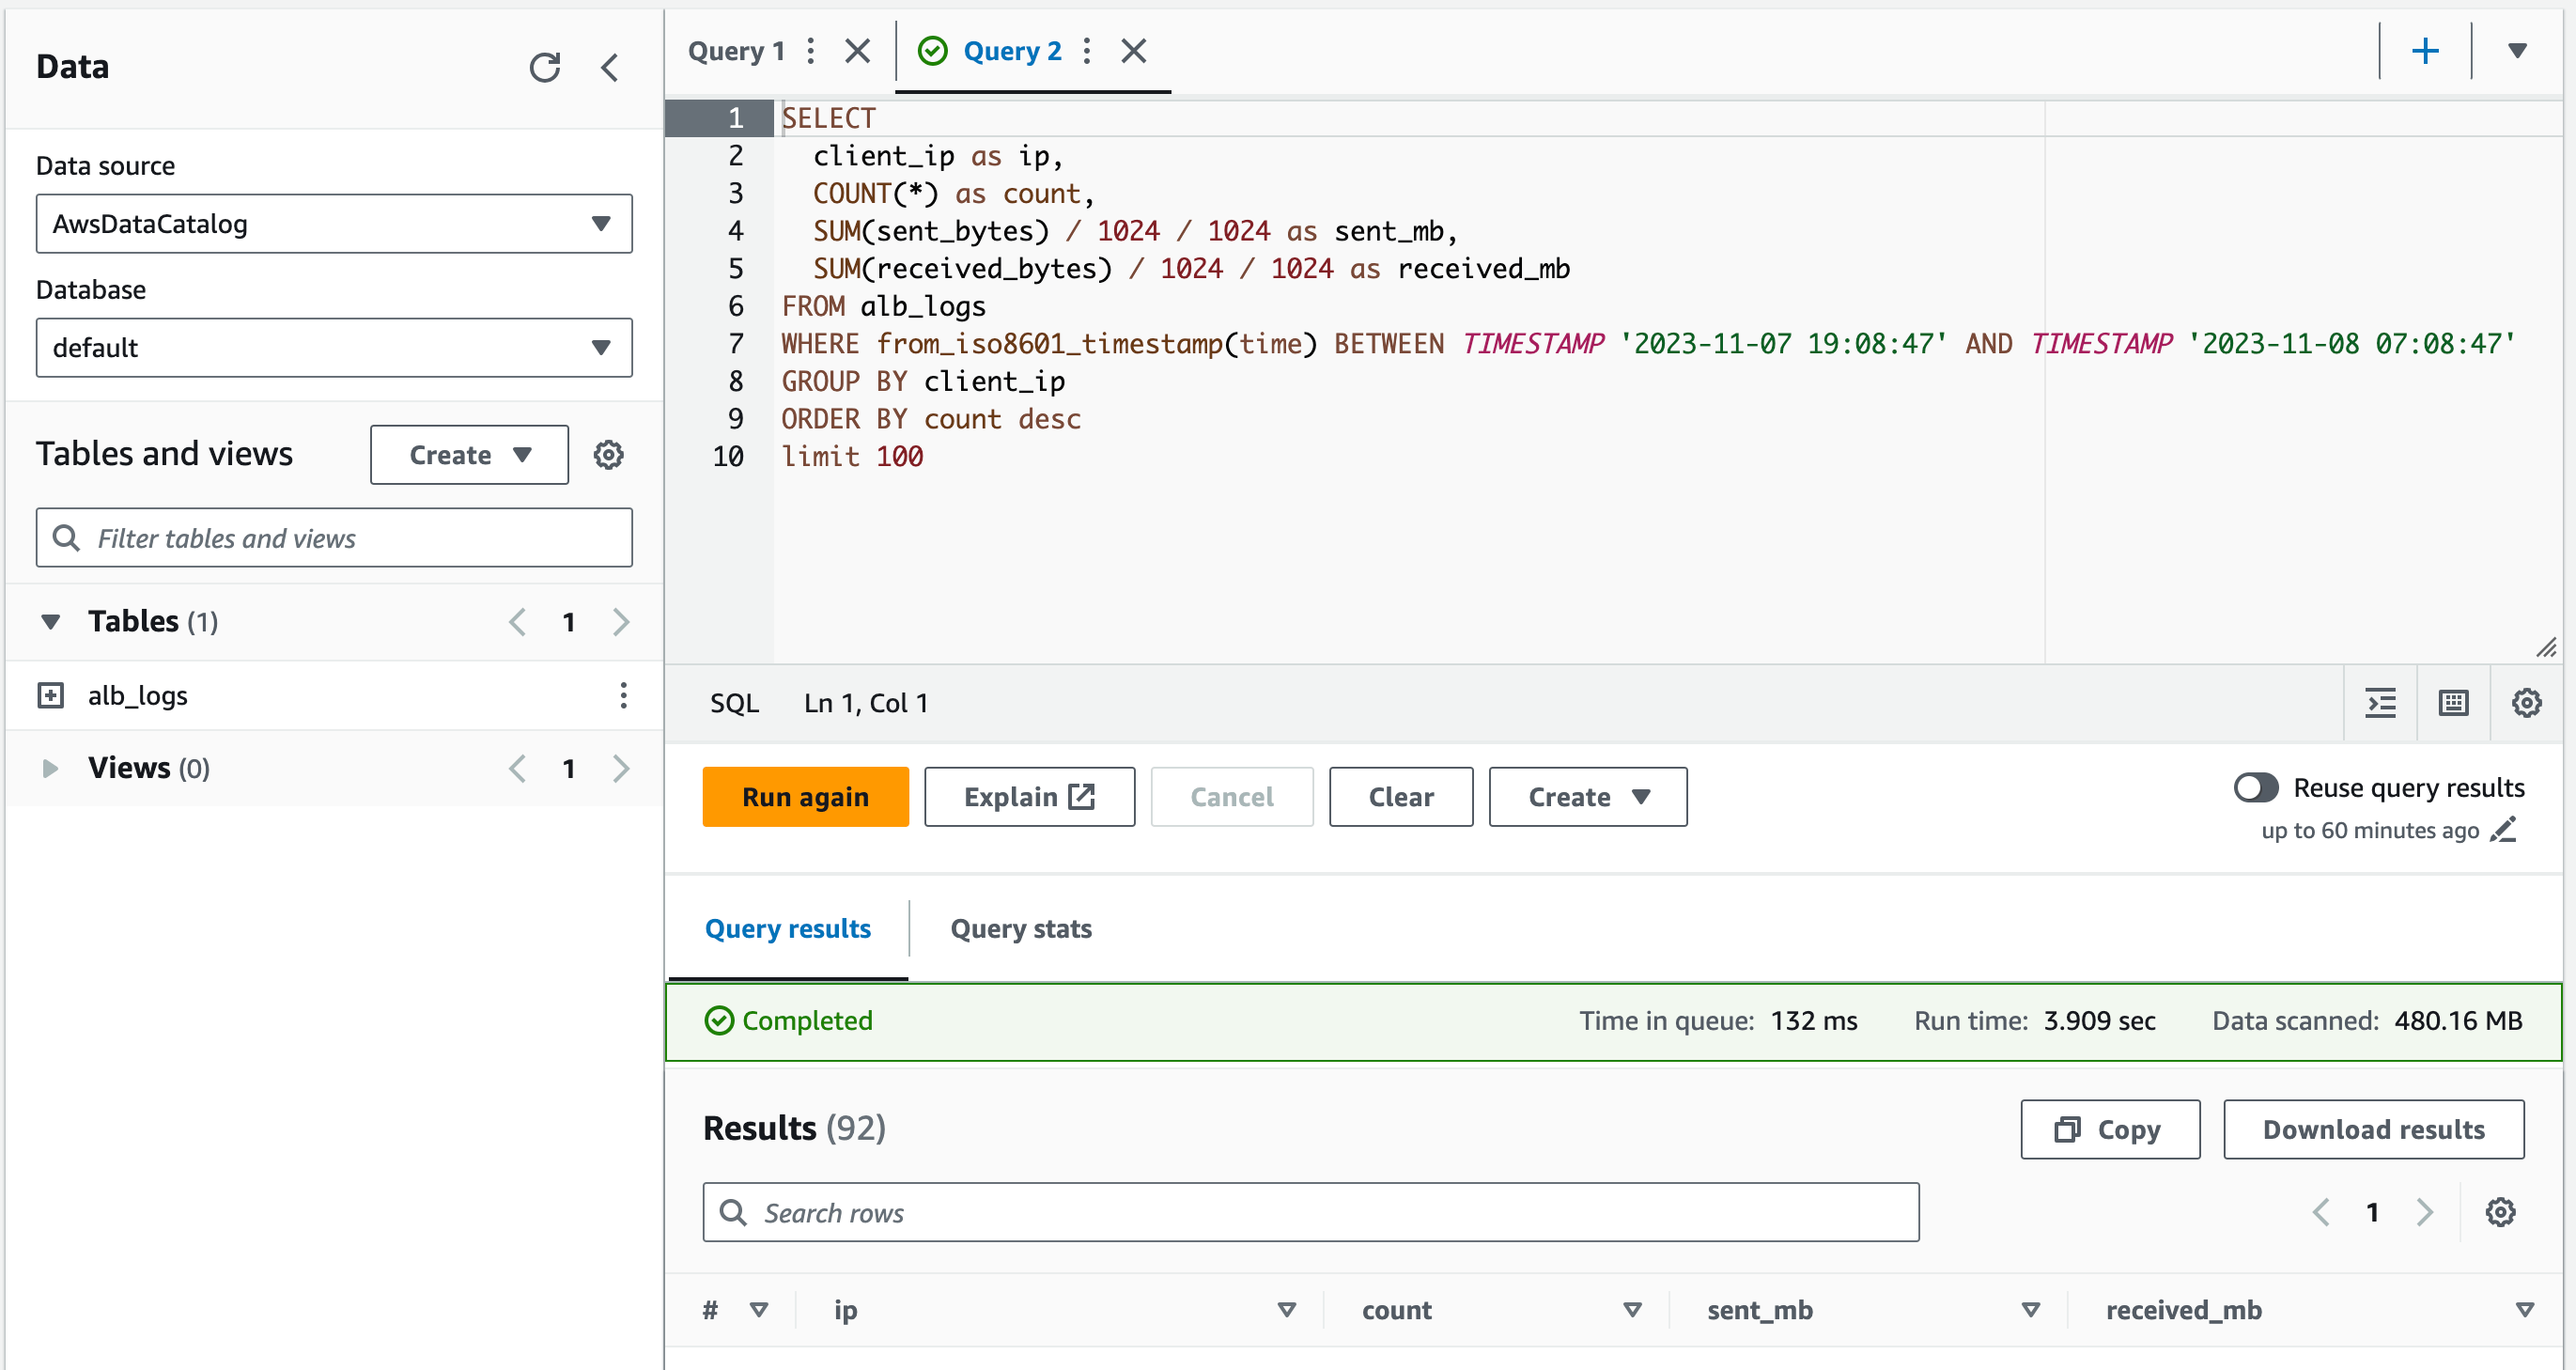
Open the query editor and create a table with the schema (if you want a partition version)
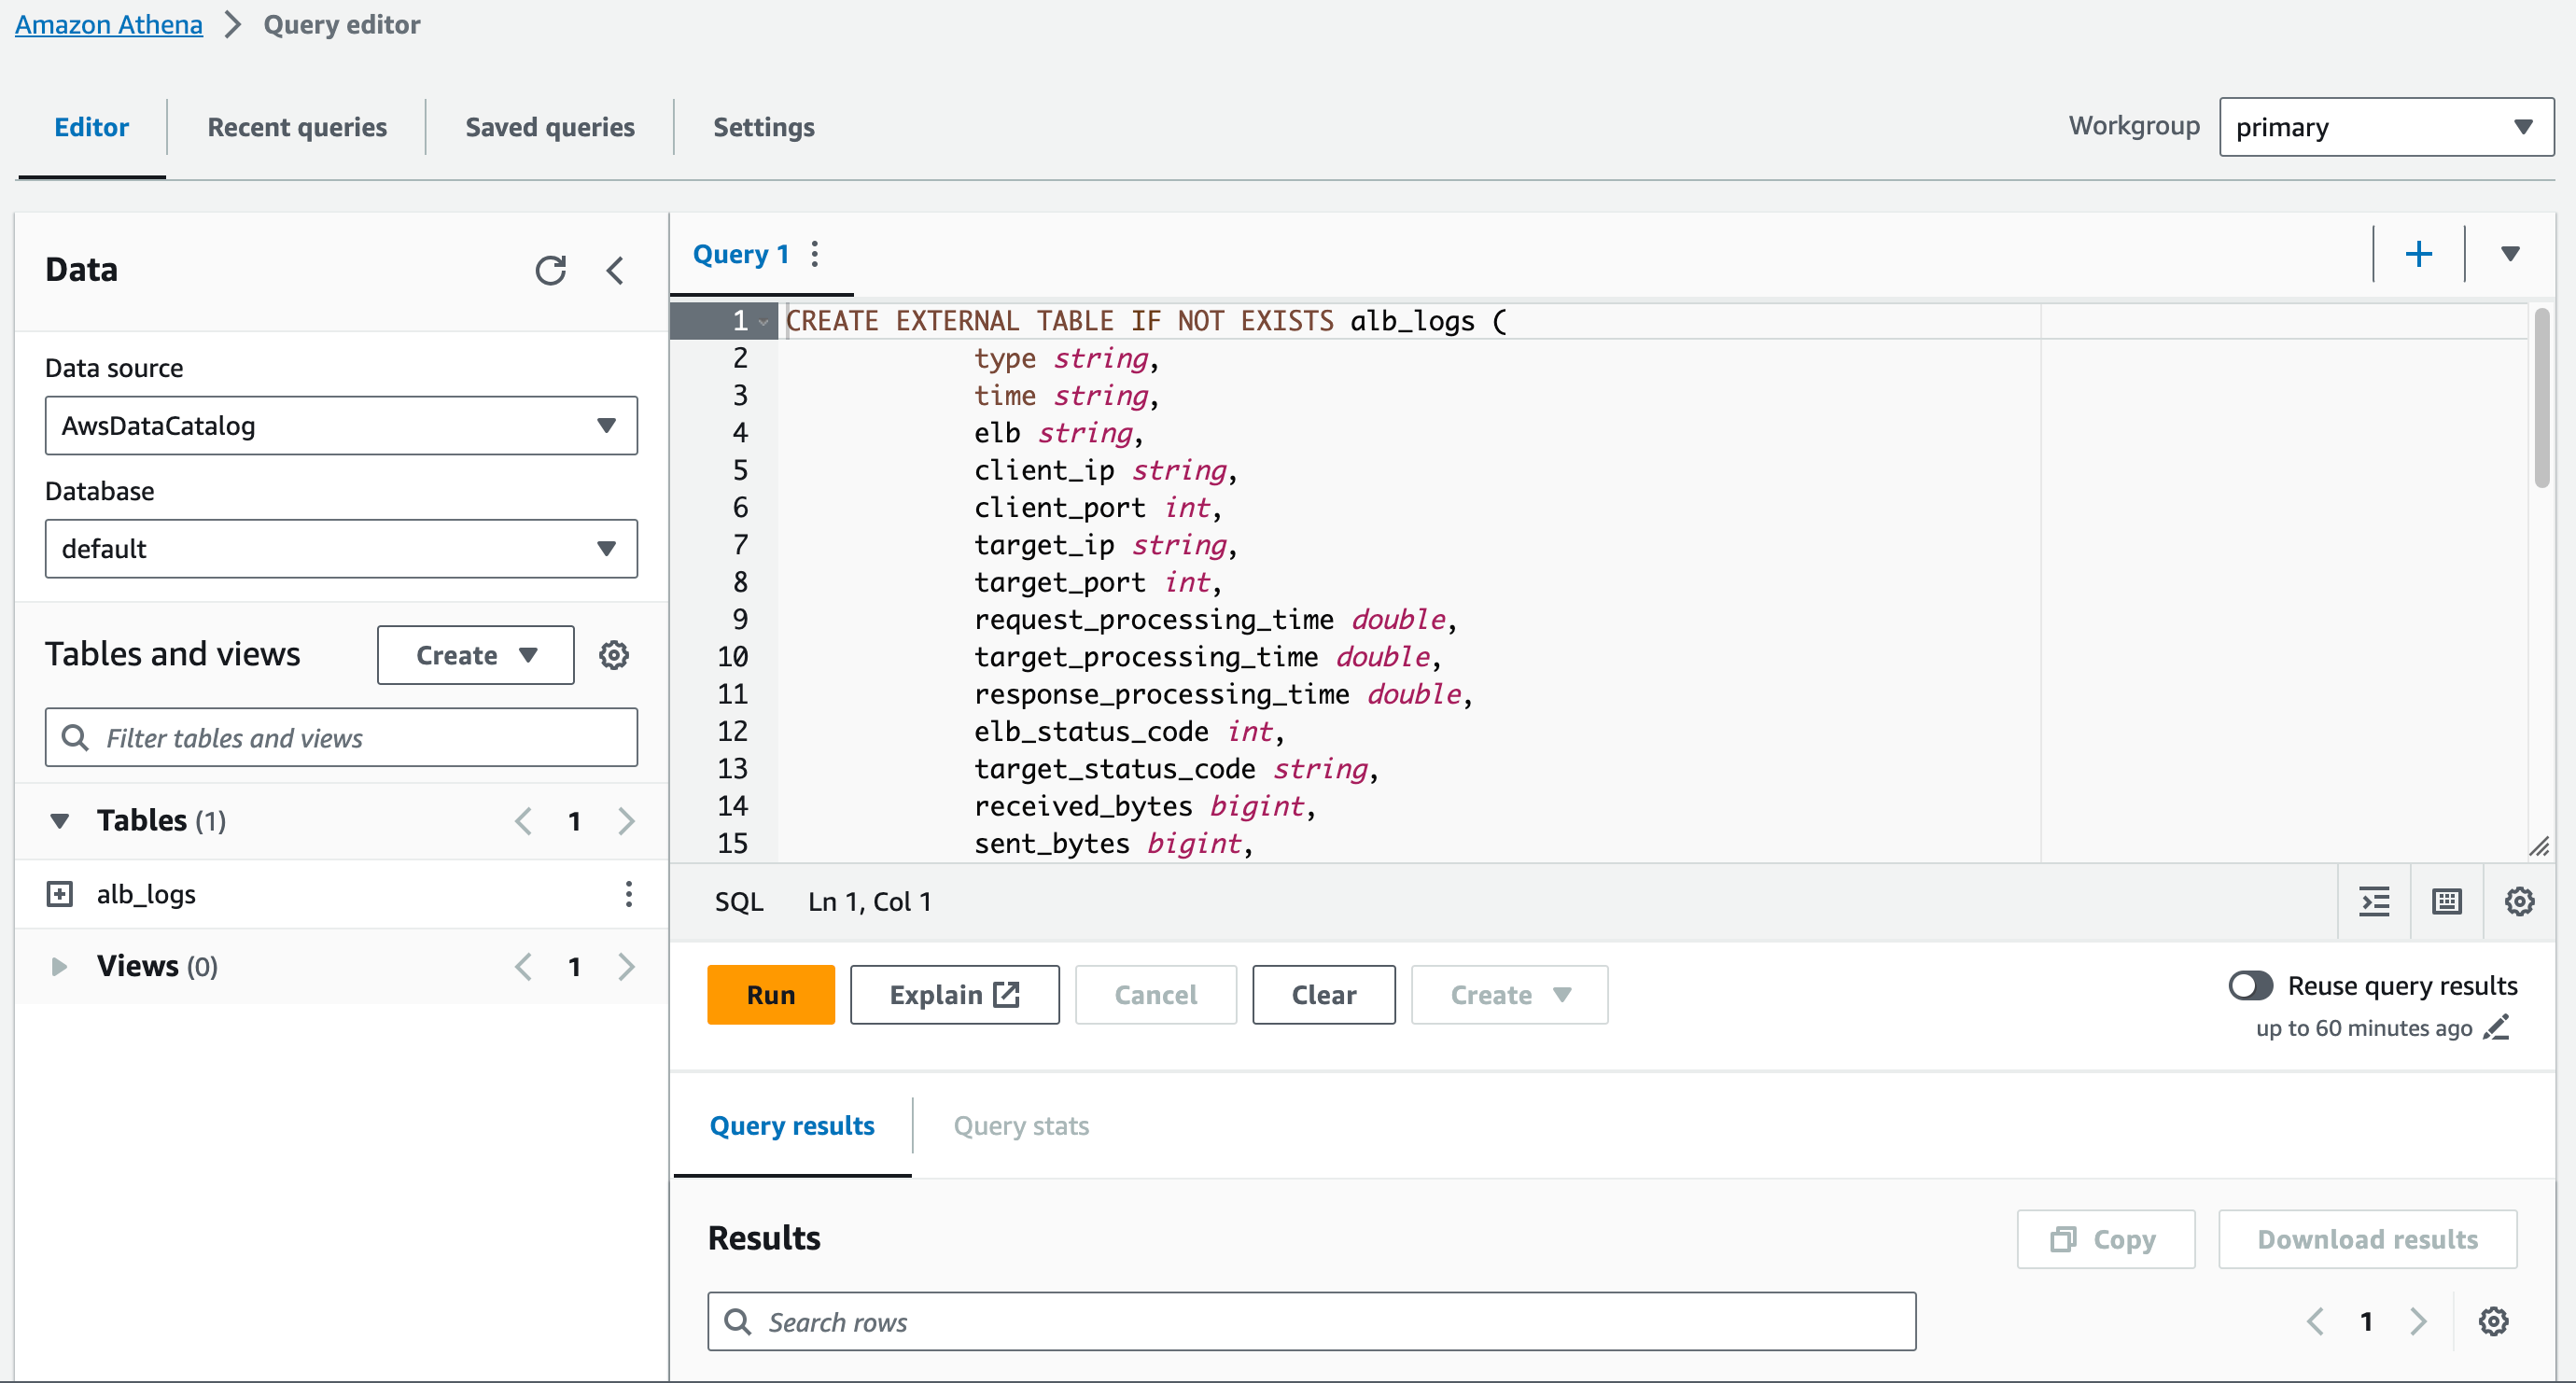
CREATE EXTERNAL TABLE IF NOT EXISTS alb_logs (
            type string,
            time string,
            elb string,
            client_ip string,
            client_port int,
            target_ip string,
            target_port int,
            request_processing_time double,
            target_processing_time double,
            response_processing_time double,
            elb_status_code int,
            target_status_code string,
            received_bytes bigint,
            sent_bytes bigint,
            request_verb string,
            request_url string,
            request_proto string,
            user_agent string,
            ssl_cipher string,
            ssl_protocol string,
            target_group_arn string,
            trace_id string,
            domain_name string,
            chosen_cert_arn string,
            matched_rule_priority string,
            request_creation_time string,
            actions_executed string,
            redirect_url string,
            lambda_error_reason string,
            target_port_list string,
            target_status_code_list string,
            classification string,
            classification_reason string
            )
            ROW FORMAT SERDE 'org.apache.hadoop.hive.serde2.RegexSerDe'
            WITH SERDEPROPERTIES (
            'serialization.format' = '1',
            'input.regex' =
        '([^ ]*) ([^ ]*) ([^ ]*) ([^ ]*):([0-9]*) ([^ ]*)[:-]([0-9]*) ([-.0-9]*) ([-.0-9]*) ([-.0-9]*) (|[-0-9]*) (-|[-0-9]*) ([-0-9]*) ([-0-9]*) \"([^ ]*) (.*) (- |[^ ]*)\" \"([^\"]*)\" ([A-Z0-9-_]+) ([A-Za-z0-9.-]*) ([^ ]*) \"([^\"]*)\" \"([^\"]*)\" \"([^\"]*)\" ([-.0-9]*) ([^ ]*) \"([^\"]*)\" \"([^\"]*)\" \"([^ ]*)\" \"([^\s]+?)\" \"([^\s]+)\" \"([^ ]*)\" \"([^ ]*)\"')
            LOCATION 's3://your-alb-logs-directory/AWSLogs/<ACCOUNT-ID>/elasticloadbalancing/<REGION>/'
(optional) You can also test the query in the editor
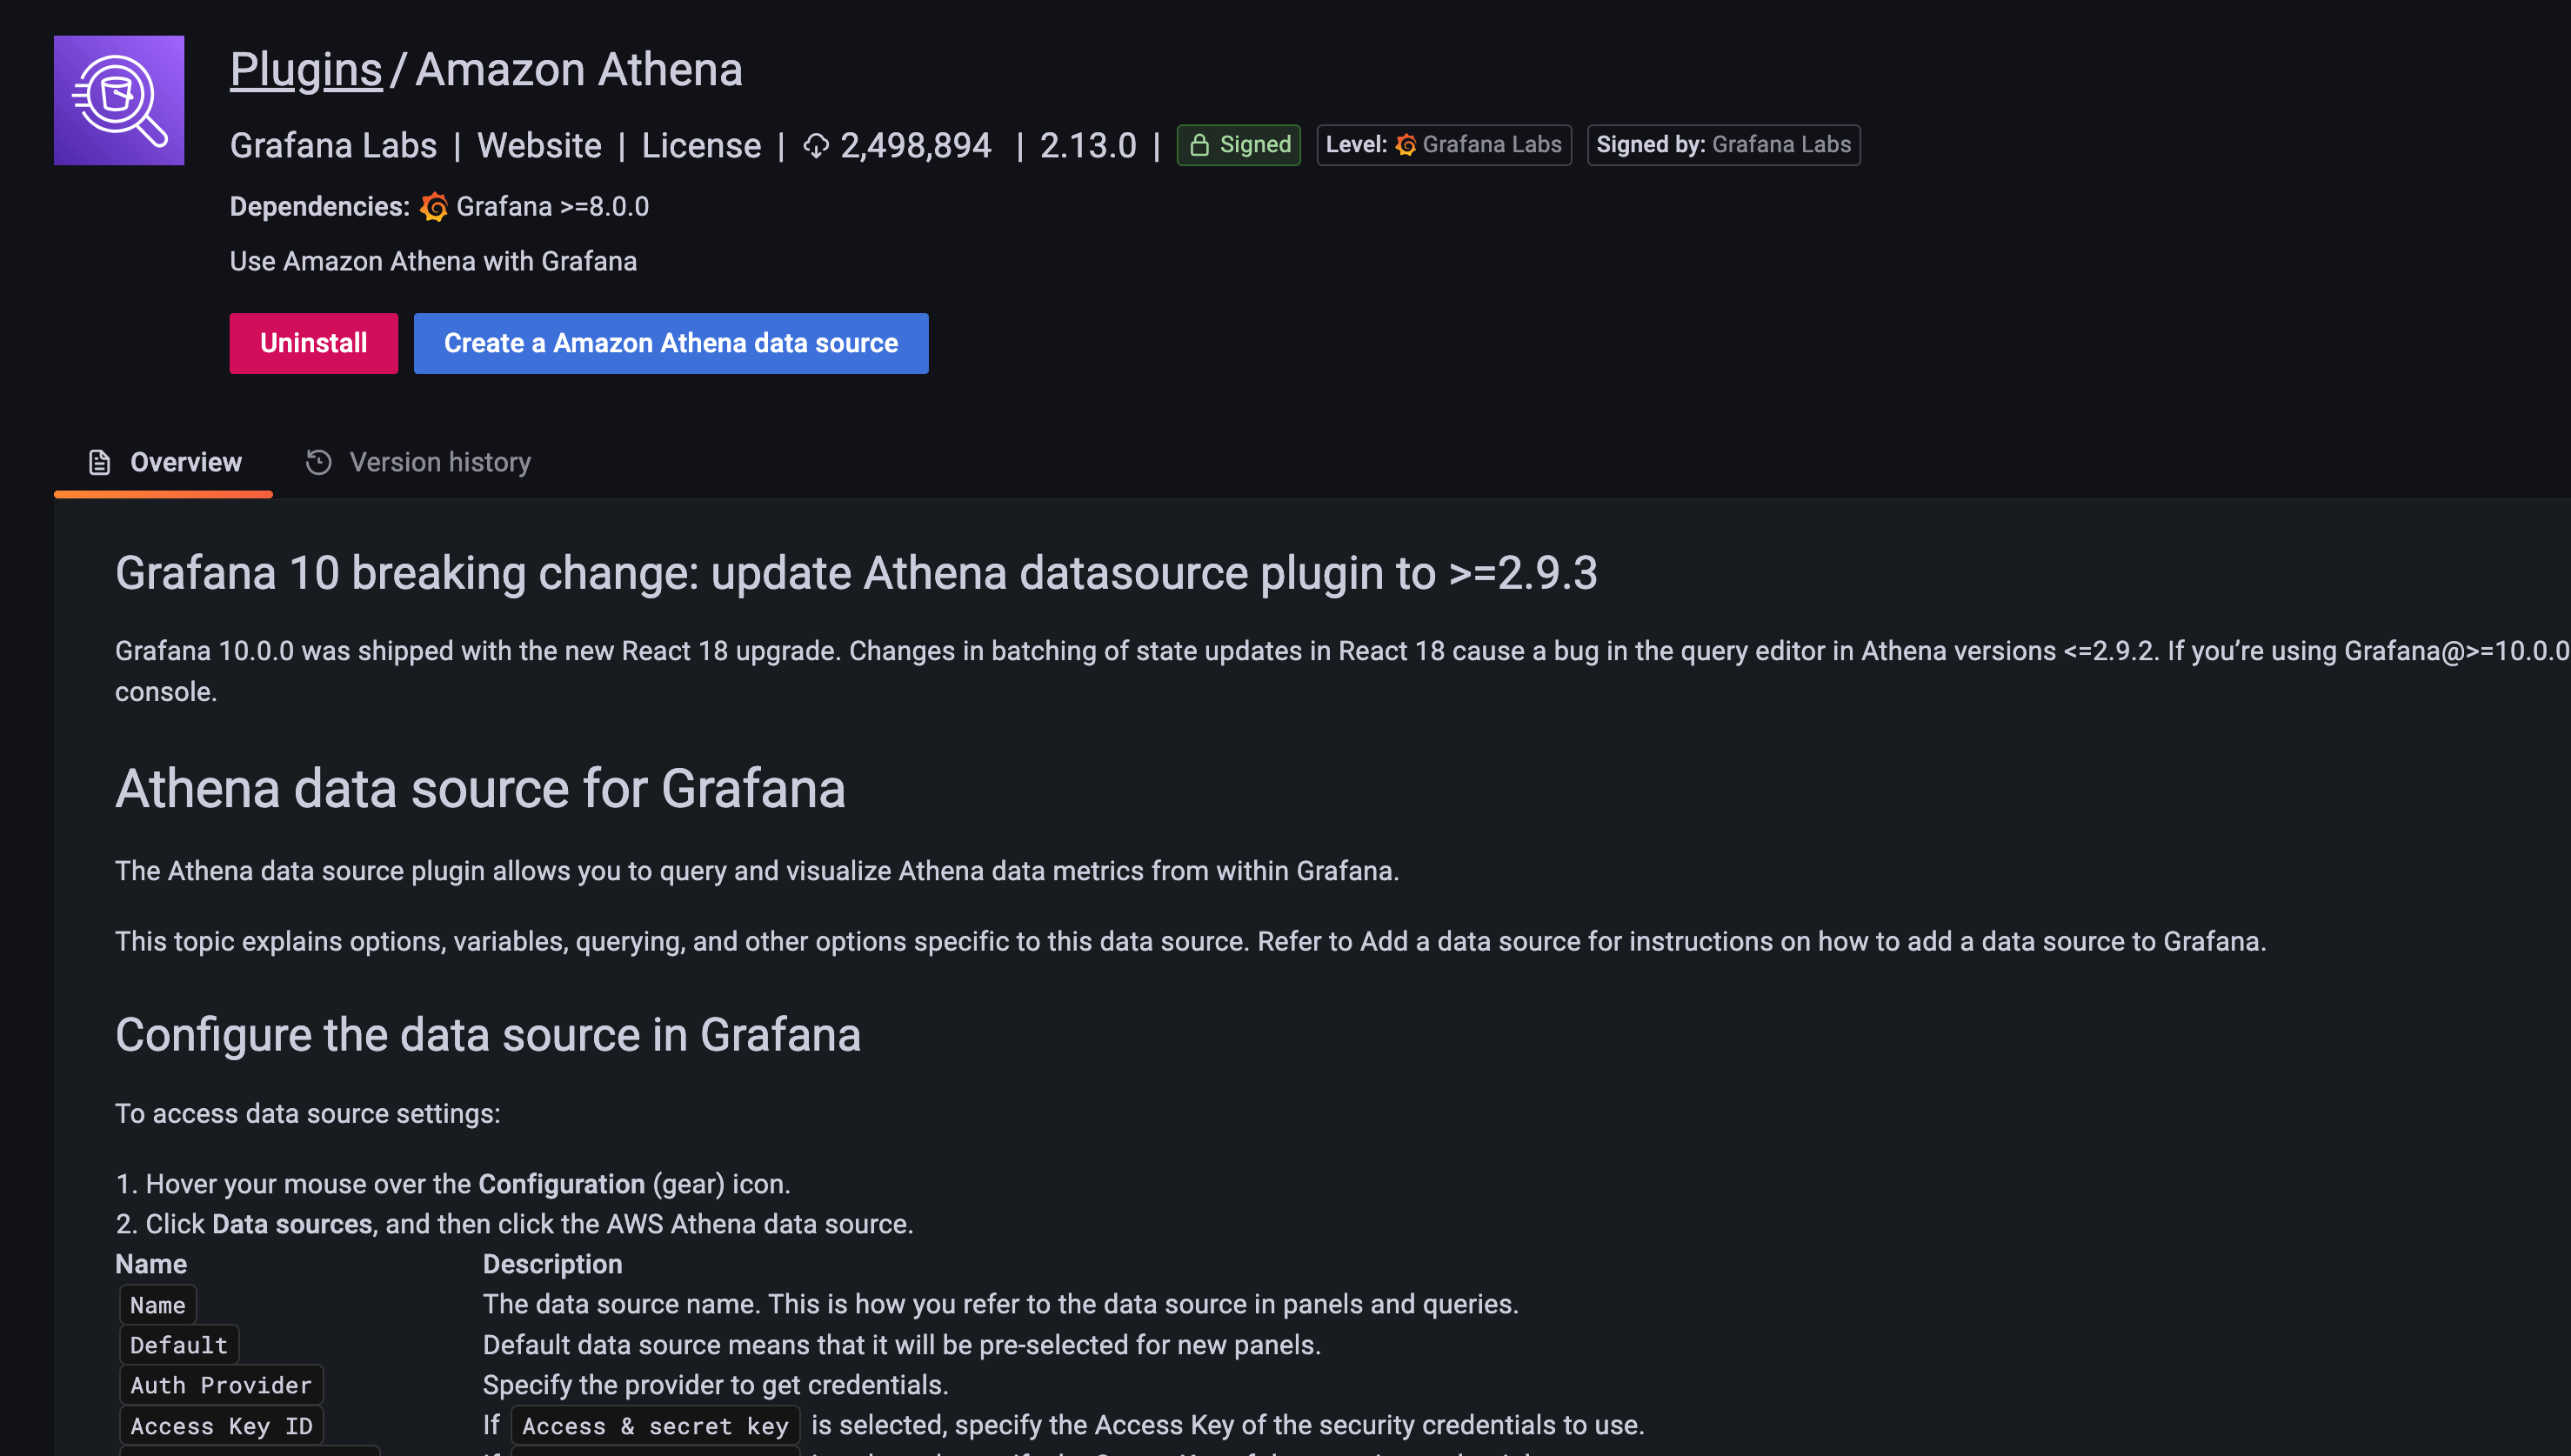
Install Anthea plugin on Grafana and configure
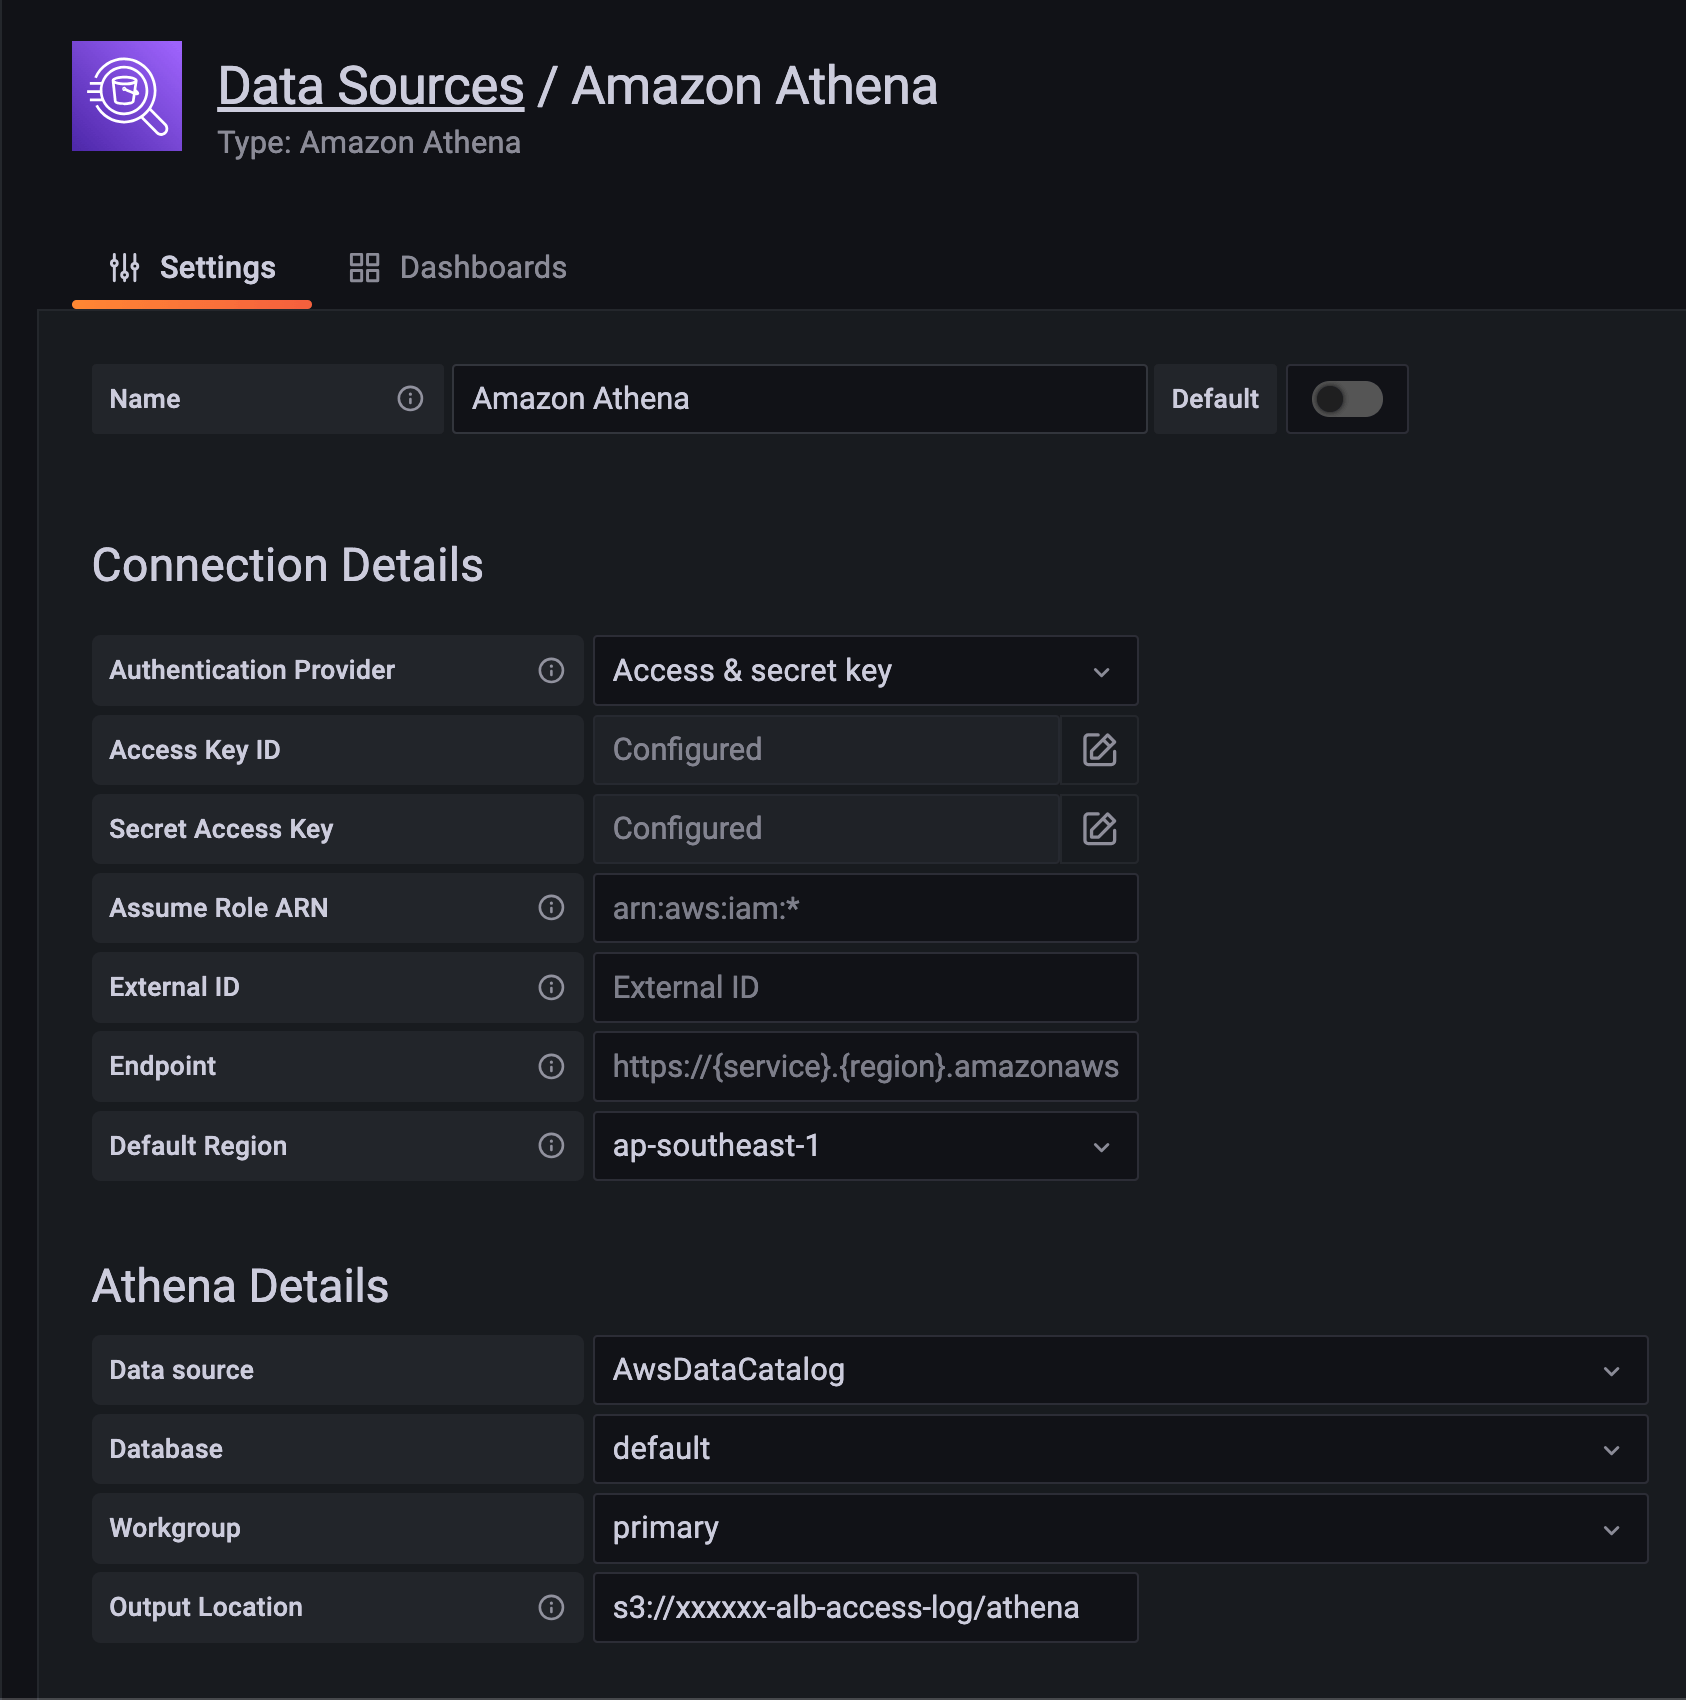
Install the plugin then create an Athena data source
Set up the credentials from the first step
(optional) explore the data
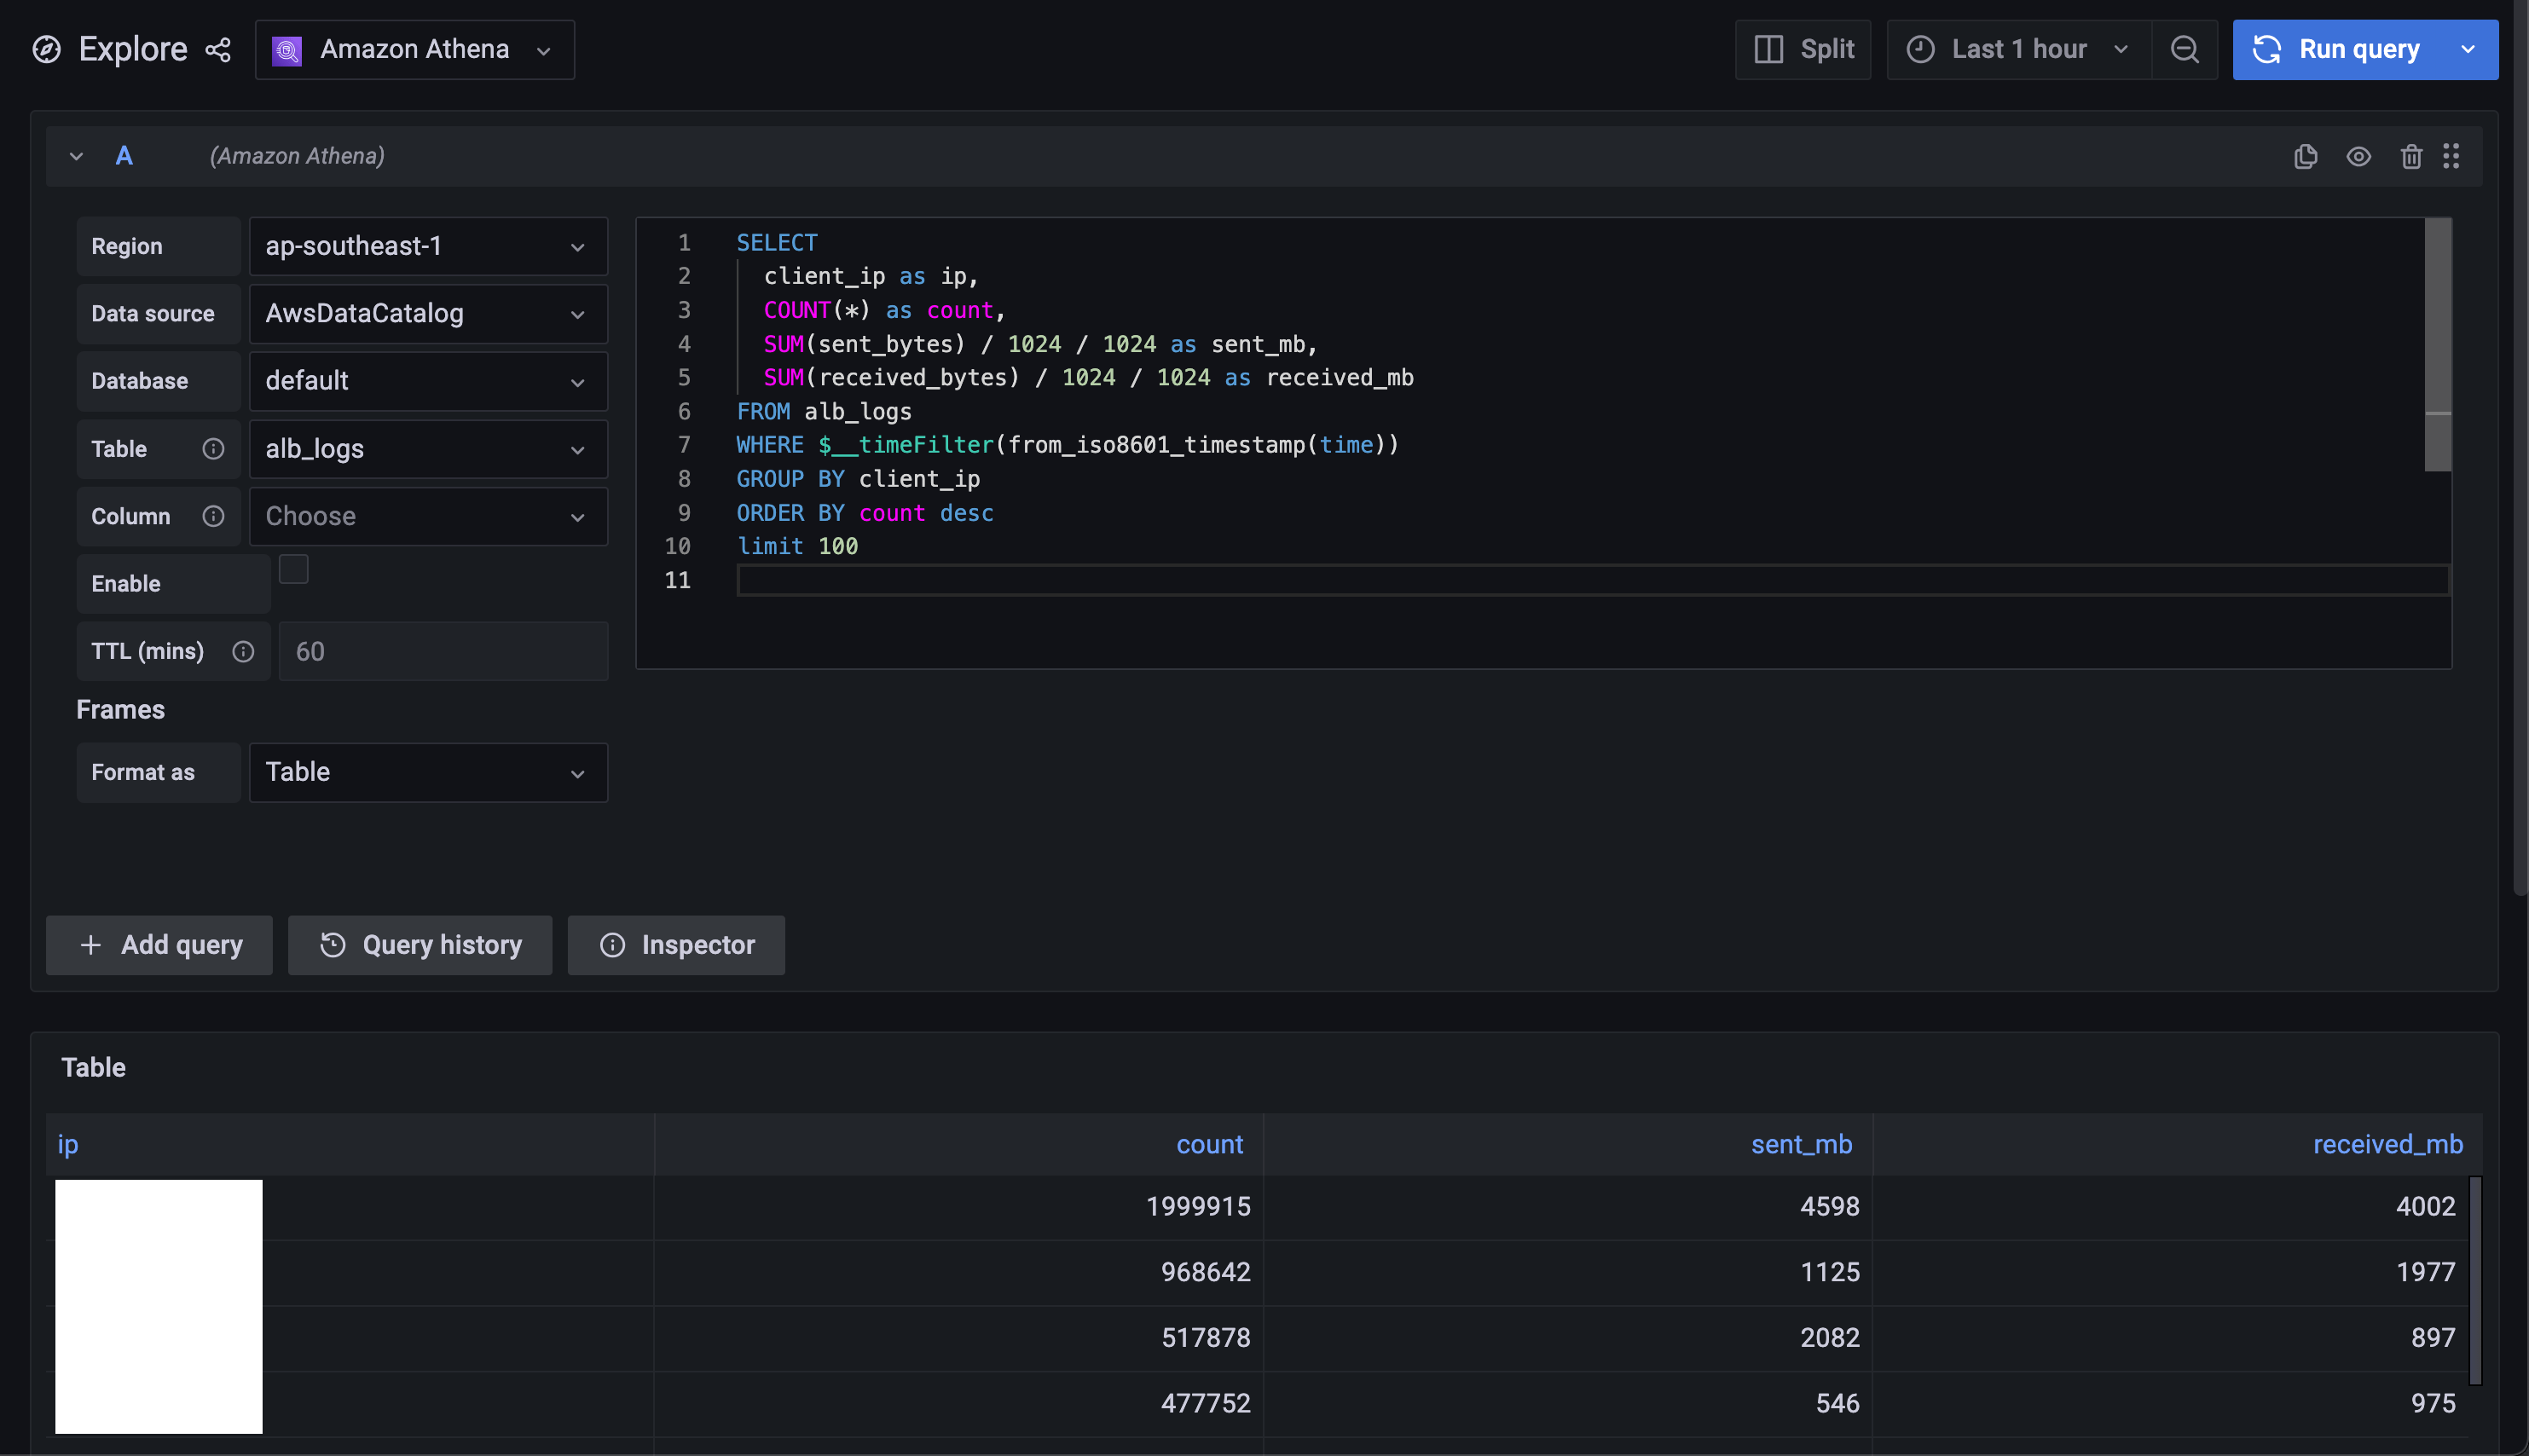
Now, you can query any data that is parsed in alb_logs and make your own dashboard or alerts. For templating variables, you can find them in the Plugin link.